I Measured My Own Multiplier
Forty-two days of agentic engineering, counted against every baseline I could find, and the ten days it took to work out the question
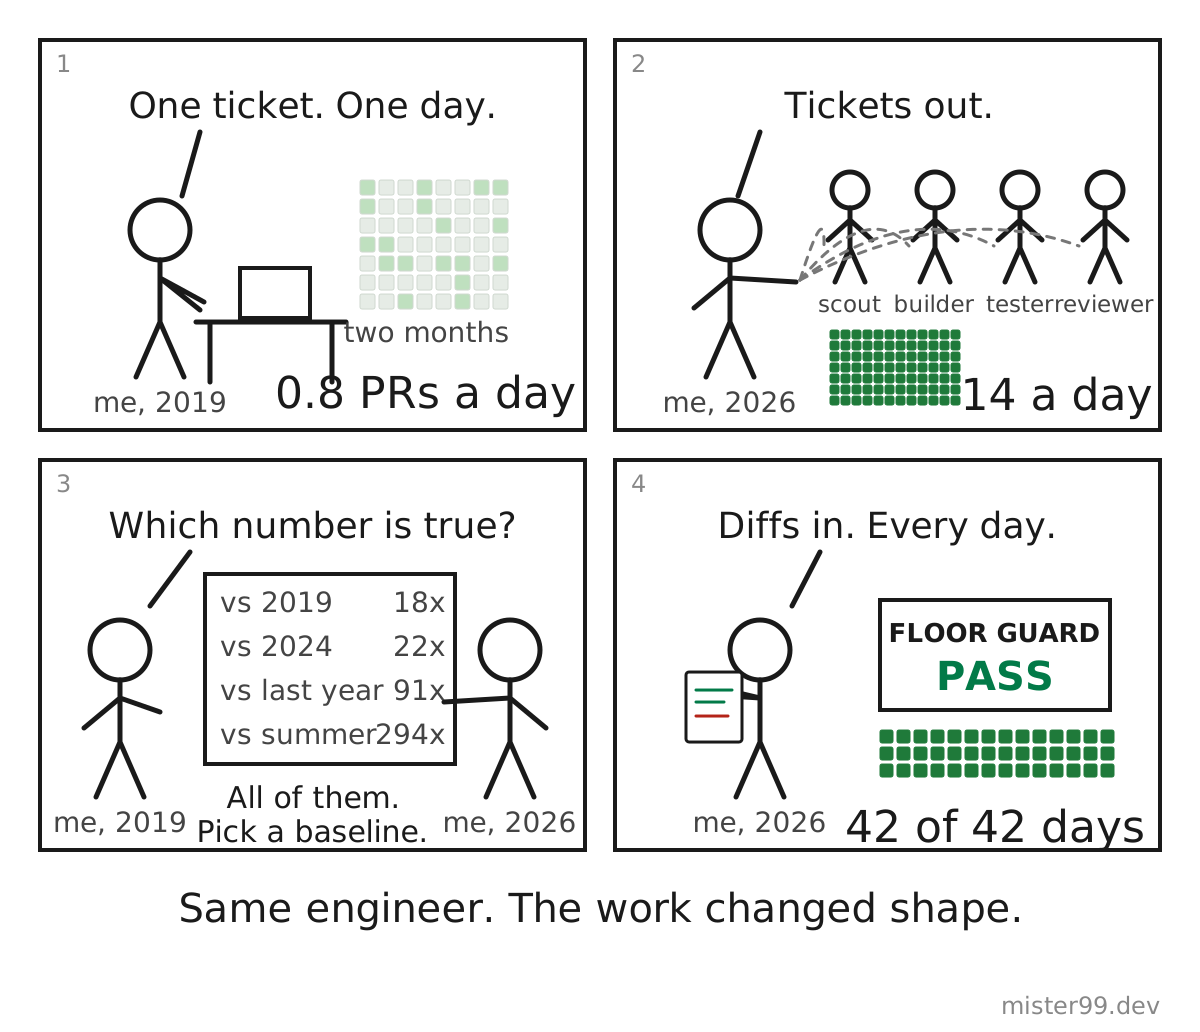
On September 11 I started working with AI agents the way I now think everyone will: tickets instead of keystrokes, a routing table instead of a chat window, every diff read before it merges. Forty-two days later I pulled my own GitHub history and asked the question people keep asking about agentic engineering. Is this 10x, or 100x? I stopped at forty-two on purpose. Douglas Adams readers know that the answer is the easy part, and that the question is what takes the work. So this essay has two halves: the answer, which turns out to depend on what you compare it to, and the ten days after, which I spent working out what the question was. The honest version is two numbers I did not expect: the multiplier on me, which is whatever you want it to be, and the multiplier on everyone and everything around me, which is close to one.
What did forty-two days look like?
GitHub counts contributions as commits, pull requests, issues and reviews. From November 2025 to September 10, 2026, my account shows 615 of them over 313 days, with 89 of those days active, about seven contributions on a day I did anything at all. The busiest day in that stretch was 29.
From September 11 to October 22 it shows 2,473 contributions over 42 days, every one of them active, about 59 a day. The busiest was October 16, with 208. October alone was 2,516, more than any full year of my career. My two best years as an individual contributor, 2018 and 2019, were 2,127 and 2,266.
Merged pull requests are the number I trust more, because a pull request is a unit of work someone else could inspect. There were 587, across 26 repositories. Most went to X-Ray, the quality gate for a family of websites that I have written about here before, and to its portal. The rest went to the company’s main website, to our engineering handbook, to an analytics repository, and to projects that are not mine at all: the Astro documentation, the Starlight theme, an open-source static site generator, an open-source tool for running teams of agents, and my own public skills repository. In the same 42 days before September 11, I merged two.
The days were long. Twelve to sixteen hours most days, weekends included, for the whole stretch. I want to say that plainly, because the numbers could look like a trick, and there was no trick. There was a routing table, a floor guard, a review loop, and a person who could not put it down. I have done this once before: for a year I ran a travel poster studio, Julian Travel Posters, and committed to making a new poster every day for 365 days. I kept it. A streak like that runs on appetite more than discipline. Agentic engineering is the first thing since the posters that I wanted to do every day, and I think that is worth saying out loud, because a lot of what gets written about this work describes it as a chore to be automated. For me it was the opposite. The agents took the part of the work that was not interesting and left me more of the part that was.
The hours did not come out of the rest of my life either, and I want that on the record, because the picture people have of a stretch like this is a dark room and a cold pizza. The job kept its shape: the meetings, the 1:1s, the onsite visits with an hour’s drive each way, and one week in early October with five of those in a row. October 17 was my birthday. I played a co-ed pickleball tournament with coworkers that afternoon and had dinner with my daughter that night. I played tennis with a colleague after work every week and doubles every Sunday at eight, coached one of my mentors at pickleball on Thursdays, ran a 5K and started running again, and reached the final of the company ping-pong tournament for the marketing department. In the middle of it all I played a golden-ticket qualifier and qualified for Sectionals, which has me thinking about Nationals. The question I get most often about agentic engineering, after whether it is really 10x, is whether it costs you your life. Mine stayed intact, and the only part I gave up was the part of the work I did not want to do anyway.
Which multiplier is the right one?
The same 42 days, against every baseline I could find:
| Baseline | Measure | Multiplier |
|---|---|---|
| My own active days, Nov 2025 to Sep 2026 | contributions per active day, 6.9 to 58.9 | 8.5x |
| My best year as an individual contributor, 2019 | contributions per month, 189 to 1,790 | 9.5x |
| 2019 | merged pull requests per day, 0.78 to 14.0 | 18x |
| 2024, as a manager | merged pull requests per day, 0.65 to 14.0 | 22x |
| The 12 months before Sep 11 | 56 merged in a year, 587 in 42 days | 91x |
| The 42 days before Sep 11 | 2 merged, then 587 | 294x |
Every row is true. None of them is the answer.
The rows at the top compare me to myself at my most productive, and they say 9x to 18x. The rows at the bottom compare me to myself as a manager who had mostly stopped committing, and they say 100x or more. Both comparisons are honest. Both are also flattering in a way that has nothing to do with agents: a manager who starts writing code again will show an enormous multiplier on code, because the denominator is close to zero.
There are smaller problems too. Agents commit in smaller pieces than I used to, so a ticket that would once have been one pull request is now three. Most of those 587 were reviewed by agents and bots and merged by me, so the count never passed through anyone else’s calendar, which a team’s count always does. And contributions before 2026 are a private total with no breakdown, so the 2019 comparison mixes commits with pull requests and issues.
When I started this exercise I expected to land on a number. What I landed on is that a multiplier measured on yourself is a number you choose. You choose it with the baseline, and you choose it with the measure. If I wanted to write “100x” in a headline I could cite the fifth row and nobody could call it false. The honest band, against the best version of me, is somewhere between 9x and 18x. I’ll call it 10x, and I think that is a fair description of what one engineer with a routing table and a floor guard can do today.
That was the answer, on day 42. The ten days after it went to the question I had not asked.
What moved for everyone else?
The teams I work with and alongside have the same tools. The same agents, the same skills, the same handbook, several of the same repositories. If the multiplier is in the tools, it should show up in their numbers too.
So I ran the same measure on them. Twenty-nine engineers across the four engineering teams closest to mine, merged pull requests, the 42 days before September 11 against the 42 days after. The sum went from 249 to 341. That is 1.37x. The median engineer went 1.25x. The strongest mover went 8x, from a small base. Two people fell by half or more. Eight had nothing merged in either window, which usually means their work lands somewhere GitHub does not count.
I want to be careful with this. 1.37x is not nothing. A third more merged work across 29 people is real. And the comparison is unfair in the ways the first table was unfair: nobody else spent 42 days at 14 hours, and nobody else was building the tooling that made their own work faster. But it answers the question I was avoiding. The agents are available to all 30 of us. One of us moved 294x on the measure and 29 moved 1.37x. The multiplier came from the way one person had restructured his work around the tools, and that restructuring had not transferred.
Then there is the second number, which is worse.
X-Ray exists to make a family of websites better. It audits every site each week, scores it, and tells the owner what to fix and how. It ran every week through this period. Across the 47 sites in every weekly run inside the window, from the first full run on September 24 to the last one on October 18, the mean Site Health Score went from 66.0 to 69.0: 38 sites up, 7 down, 2 unchanged.
Three points. And I cannot credit even those to fixes, because X-Ray’s checks changed every single week in that period. New checks were added, and thresholds were re-measured and moved. Some of that movement is probably real, and I cannot show which part. A score that moves three points inside a tool whose rules changed every week is not yet a trend.
The tool’s own issue tracker says it best. The ticket for a remediation workflow opens with the line that X-Ray finds problems faster than anyone can fix them, and lists what is missing: who triages, who fixes, with what capacity, tracked where, with what target time. All of those boxes are still open. There is one rule in place, approved in October, for one platform’s releases: anything a visitor would notice gets reworked before launch, and the rest goes to a backlog. Nothing covers the weekly run.
So the honest profile after 42 days is this. On throughput, 10x. On the team, 1.37x. On the thing the throughput was for, about 1x. I built a machine that reports at ten times the speed and connected it to a world that fixes at the old speed.
Why isn’t it 100x yet?
I have a working definition of each level now, and it is not about tools.
1x is an assistant that helps you type. The shape of your work is unchanged; you do the same things a bit faster.
10x is one person restructuring their own work around agents: tickets small enough for a worker to finish alone, a routing table that sends each step to the cheapest model that can do it, a floor that cannot be lowered quietly, and a person who reads every diff. I have written about each of those pieces. Together they get you the first table.
100x is when the restructuring is no longer yours. Other people’s throughput moves. Work runs without your attention being the bottleneck. And the outcome the work was for moves too, measurably, in a way you did not have to argue for.
By that definition, three things are missing, and I can put a number or a date on each.
The team has not moved. 1.37x, measured. I spent 42 days learning to lead agents and nobody learned it beside me. Every skill and rule I wrote is in a repository the team can read, and reading is not how anyone learned this. I learned it by doing it fourteen hours a day with the floor guard failing my pull requests. The transfer has to be the same: a person, a ticket, a review loop, next to someone who has done it.
The autonomous loops are mostly still mine. One is running without me. Every thirty minutes, a job on a laptop at home takes the oldest open bug in X-Ray’s own tracker that nobody has claimed and hands it to a build seat in an open-source rig tool; a second seat reviews the result, and I ship it. That loop has taken its first tickets. Everything else that would make X-Ray act on its own, from audits triggered when a page is published to runs hosted where a team can start them, is a ticket, a draft, or a pull request waiting on infrastructure that is not mine to merge.
Nothing measures the outcome. The score is the only outcome number I have, and I just explained why it does not count. Days from a finding to its fix, read from the run history, is the number that would. X-Ray already records, run by run, which findings are new and which stopped appearing. Nobody has yet asked it to add up the days in between.
I also want to say something about the hours, because they bear on the definition. A 100x that depends on one person working sixteen hours a day is a 10x with no sleep. Part of what separates the two levels is that the second one has to survive the person going home.
What would resolving look like?
The gap between finding and fixing is where the next level is, so the next thing X-Ray learns to do is resolve.
The plan is three lanes, sorted by how much a wrong fix would cost.
Low risk, resolved without supervision. A finding whose fix is mechanical and reversible: a missing alt text drawn from the image’s own file name and the caption beside it, a stale copyright year, a redirect chain collapsed to its target, a sitemap entry that points at a page that moved. X-Ray makes the change, commits it or saves it in the content system, and reports it as done in the next run. The rule for this lane is that the fix has to be one the tool can verify itself on the next crawl, and one a person could revert in a minute.
Medium risk, ready for review. A fix a person should see before it goes live: a rewritten page title, a claim that drifted from its approved wording, a form that posts to the wrong endpoint, a heading structure that needs reordering. X-Ray opens the change as a pull request or a draft in the content system, with the finding, the evidence and the fix side by side, and the owner approves or declines. Nothing lands until a person says so.
Hard, a written approach. A finding whose fix needs a decision: a layout that overflows on phones because the design assumes a width, an accessibility failure baked into a component, a page that has no server-rendered text for the crawlers that feed AI answers. X-Ray writes the approach: what is wrong, what the options are, what each would cost, and which it recommends. The owner decides. The work is still a person’s, but the thinking that used to start from zero now starts from a page.
The check decides the lane, in its own definition, and no model gets a vote. Each check already carries a line that tells a reader how to fix what it reports; the next field is which lane the fix belongs in, and the floor guard will refuse a check that does not say. A fix that fails verification on the next crawl moves its check up a lane. A lane assignment is a severity call, and severity calls never leave the human.
The metric is days from finding to fix, per site, read from the run history. The first lane runs on the sites in the weekly run by Christmas, which is the gift I’d most like to give the people who have spent this fall reading X-Ray’s findings: a run with fewer of them, because some were fixed before anyone had to read them. The number goes on the dashboard beside the score, because a score that improves on its own is the only one I will believe.
What can you reuse?
- Measure yourself against your best self, and say which self. Any multiplier on your own history is a choice of baseline. Publish the table, not the row.
- Then measure everyone else. The number that tells you whether you have changed anything is the one on the people and systems around you. Mine was 1.37x, and I would not have known without running it.
- Count the outcome before you count the output. If the thing your output was for has not moved, your multiplier is a claim about effort. Find the outcome number, and if the tool’s own rules moved during the period, say so before you read the trend.
- Transfer is a job, not a side effect. Skills in a repository are documentation. Someone becomes 10x by doing the work next to someone who already is, with the review loop on. Budget for that, or the 10x stays at one desk.
- Close the loop you opened. A tool that reports faster than the world can fix has made the world worse in one way: it is now behind on more things. Sort the fixes by risk, resolve the cheap ones, draft the middle ones, plan the hard ones, and measure the days in between.
The pace did not drop while I measured. In the ten days after day 42, another 198 pull requests merged, at 68 contributions a day, which is a little faster than the forty-two before them. Forty-two days gave me an answer I can defend, 10x. The ten days after gave me the question, and I cannot answer it yet. The next 10x is other people’s, and I think that is the more interesting problem.